Datadog
This tutorial explains how to analyze Cloudflare metrics using the Cloudflare Integration tile for Datadog.
Overview
Before viewing the Cloudflare dashboard in Datadog, note that this integration:
- Is available to all Cloudflare customer plans (Free, Pro, Business and Enterprise)
- Is based on the Cloudflare Analytics API
- Provides Cloudflare web traffic and DNS metrics only
- Does not feature data coming from request logs stored in Cloudflare Logs
Task 1 - Install the Cloudflare App
To install the Cloudflare App for Datadog:
Log in to Datadog.
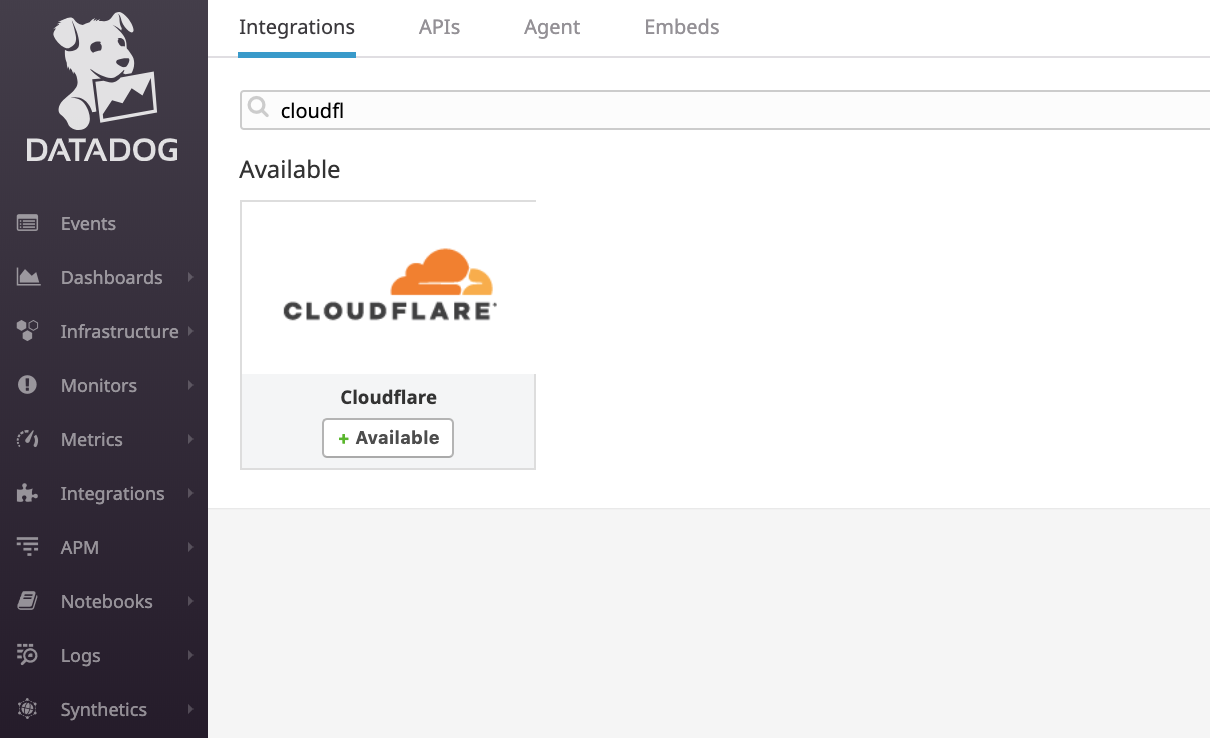
Click the Integrations tab.
In the search box, start typing Cloudflare. The app tile should appear below the search box.

Click the Cloudflare tile to begin the installation.
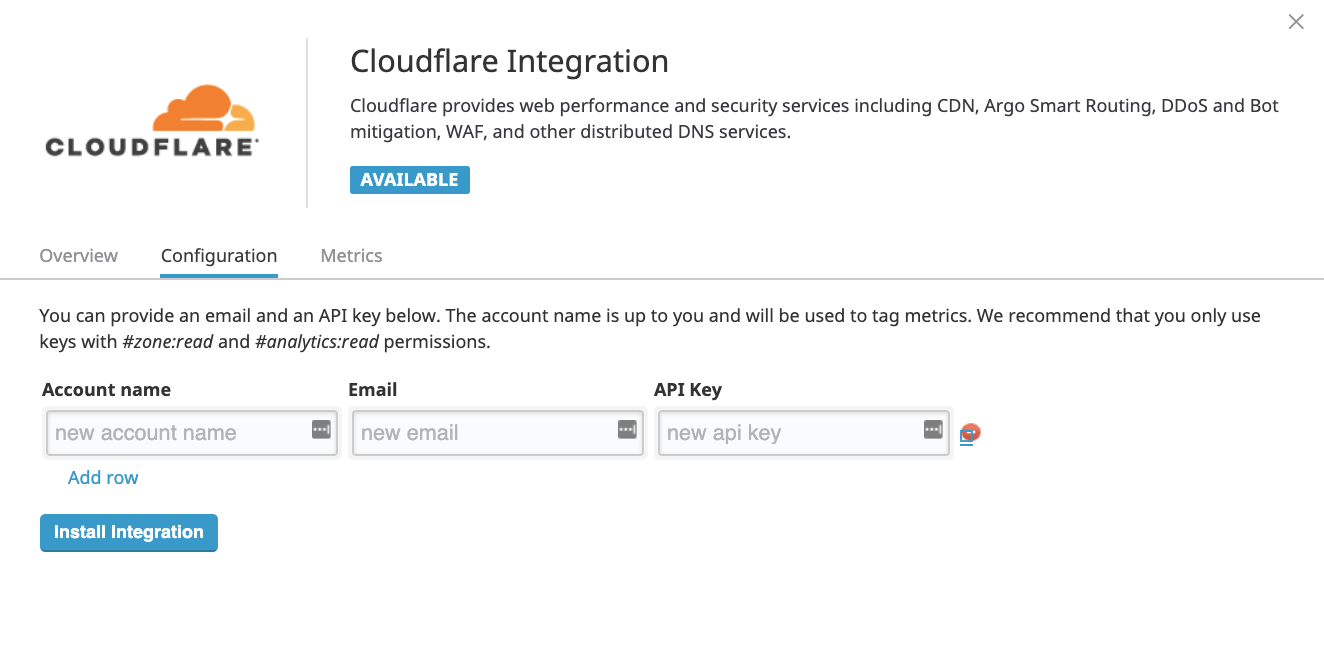
Next, click Configuration and then complete the following:
Account name: (Optional) This can be any value. It has not impact on the site data pulled from Cloudflare.
Email: This value helps keep your account safe. We recommend creating a dedicated Cloudflare user for analytics with the Analytics role (read-only). Note that the Analytics role is available to Enterprise customers only.
API Key: Enter your Cloudflare Global API key.
Click Install Integration.

The Cloudflare App for Datadog should be installed now and you can view the dashboard.
Task 2 - View the dashboard
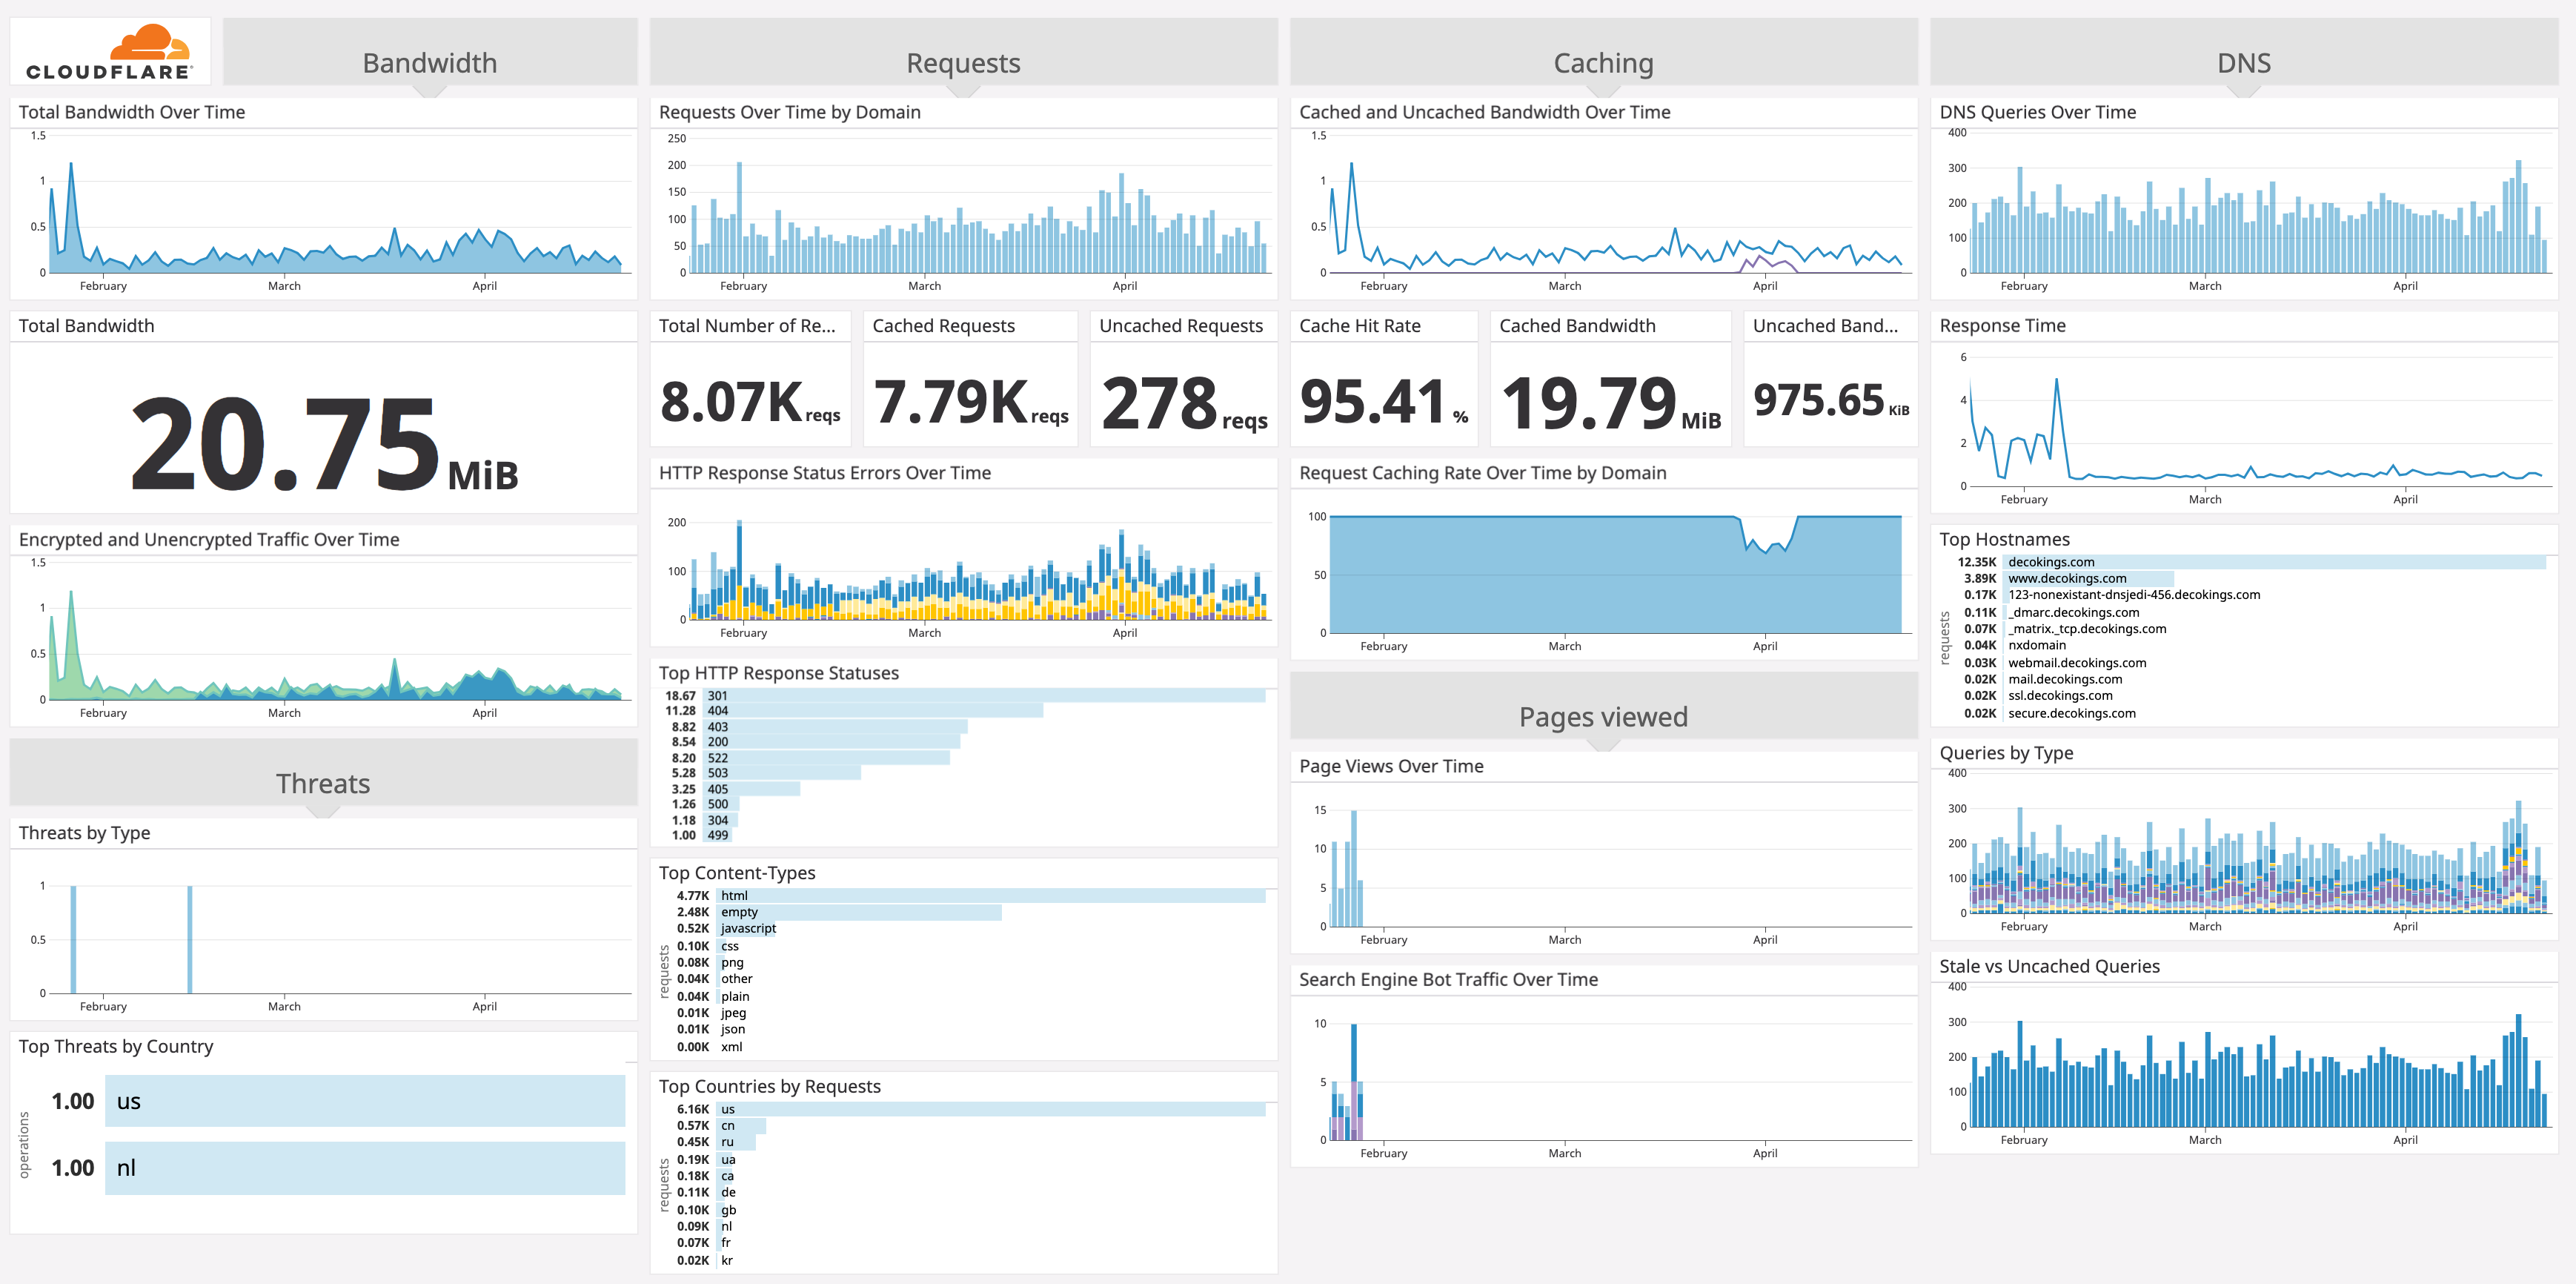
By default, the dashboard displays metrics for all sites in your Cloudflare account. Use the dashboard filters see metrics for a specific domain.
The dashboard displays the following metrics:
- Threats (threats by type, threats by country)
- Requests (total requests, cached requests, uncached requests, top countries by request, requests by IP class, top content types)
- Bandwidth (total bandwidth, encrypted and unencrypted traffic cached bandwidth, uncached bandwidth)
- Caching (Cache hit rate, request caching rate over time)
- HTTP response status errors
- Page views
- Search Engine Bot Traffic
- DNS (DNS queries, response time, top hostnames, queries by type, stale vs. uncached queries)
